EST
ENG
Legislation of Tallinn University of Technology
TalTech logo
Frontpage
Legislation
Dictionaries
English terminology
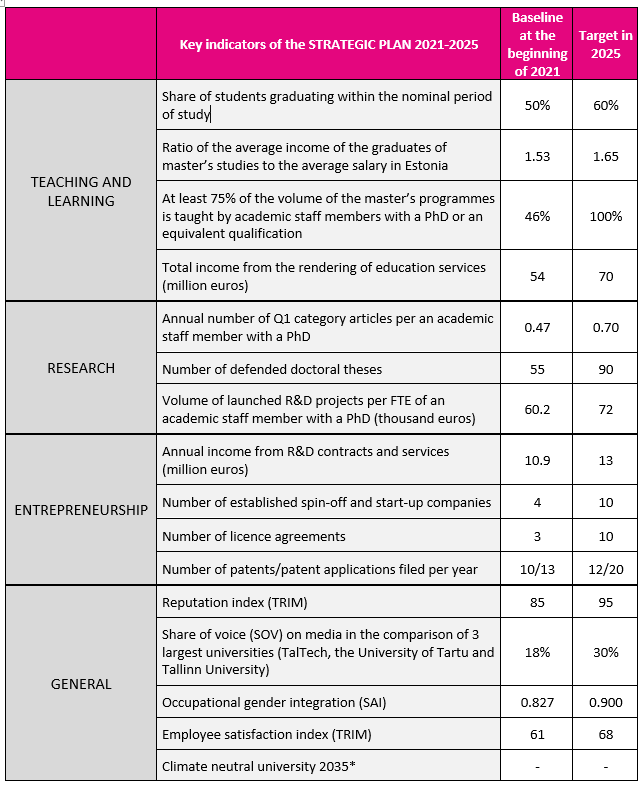
Key indicators of the Strategic Plan 2021– 2025 of Tallinn University of Technology
Responsible department:
Rectorate Strategy Office
Relation with university processes
Strategic management
Approved by Resolution No 2 of 19 March 2021 of the Council of Tallinn University of Technology
In force from: 23.04.2021
FULL TEXT-ORIGINAL TEXT
*The key performance indicator will be defined by 31.12.2022.
Go back